Javascript
The Javascript Block is ideal for performing the most complex data transformation tasks. It also has access to certain NPM packages such as axios. Others can be added on request.
It allows you to perform more or less any task that is not handled by another Block.
In place or full screen editing
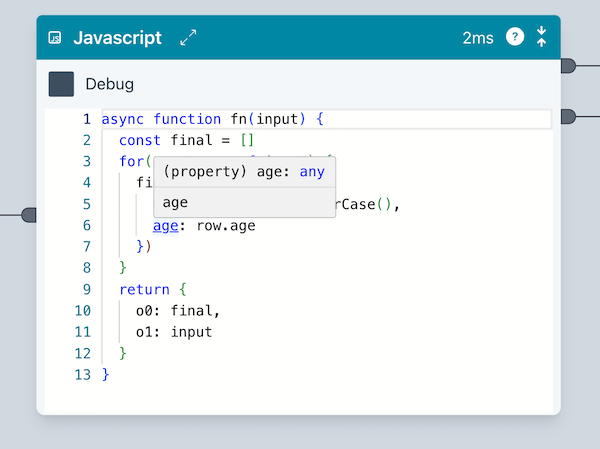
There are two Javascript editing modes. You can edit in place in the Flow.
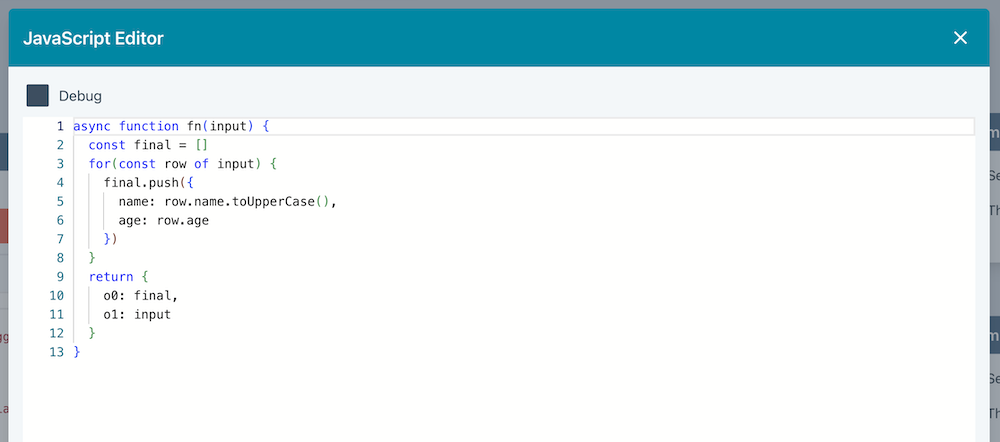
When your code gets too large for in-place editing, then press the expand icon in the Block header.
Inputs and Outputs
Inputs
Data is read from the incoming edge or edges. The Block will automatically add as many output edge connectors as there are input arguments. If you provide no arguments, then the edge data will be ignored.
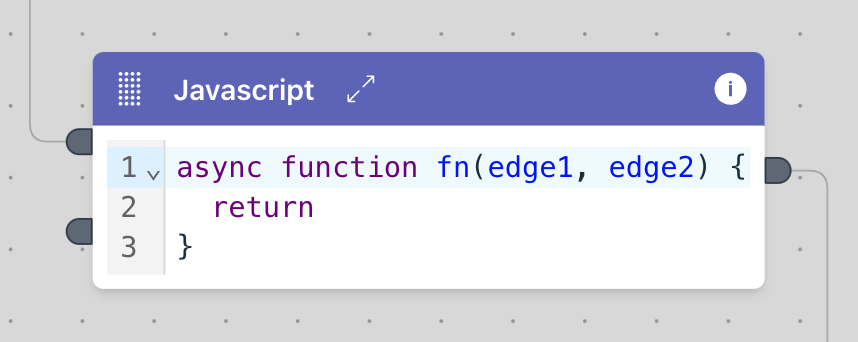
In the above screenshot, you can see two arguments input0 and input1 which result in two corresponding input edge connectors. You can name the function arguments as you wish.
Outputs
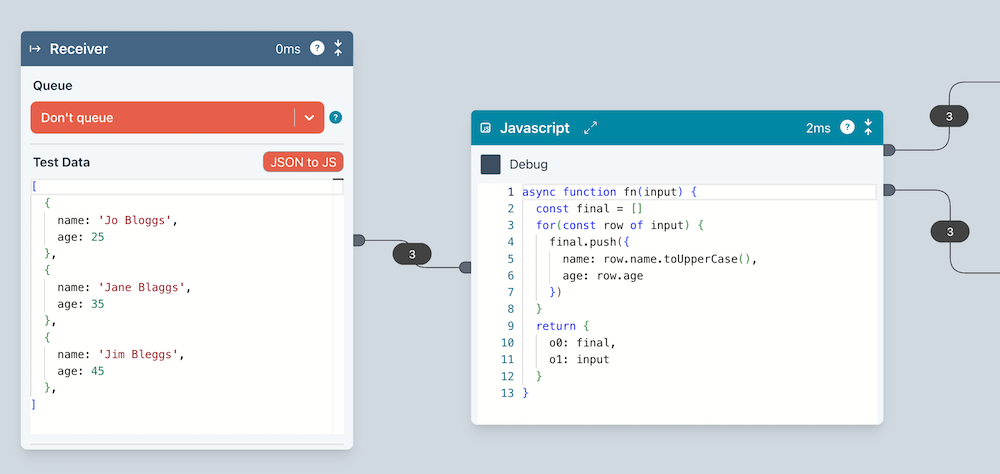
The return structure is examined to determine how many output edge connectors should be available. You should output data as an array of objects. The following example shows a simple example.
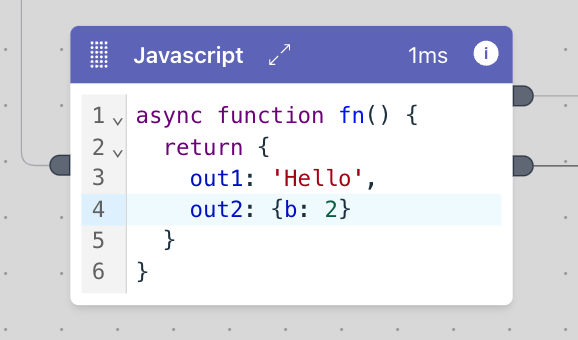
You can also output data on multiple edges.
Branching to edges
You can handle any branching logic using the branchTo(edgeIndexZeroBased, data) method.
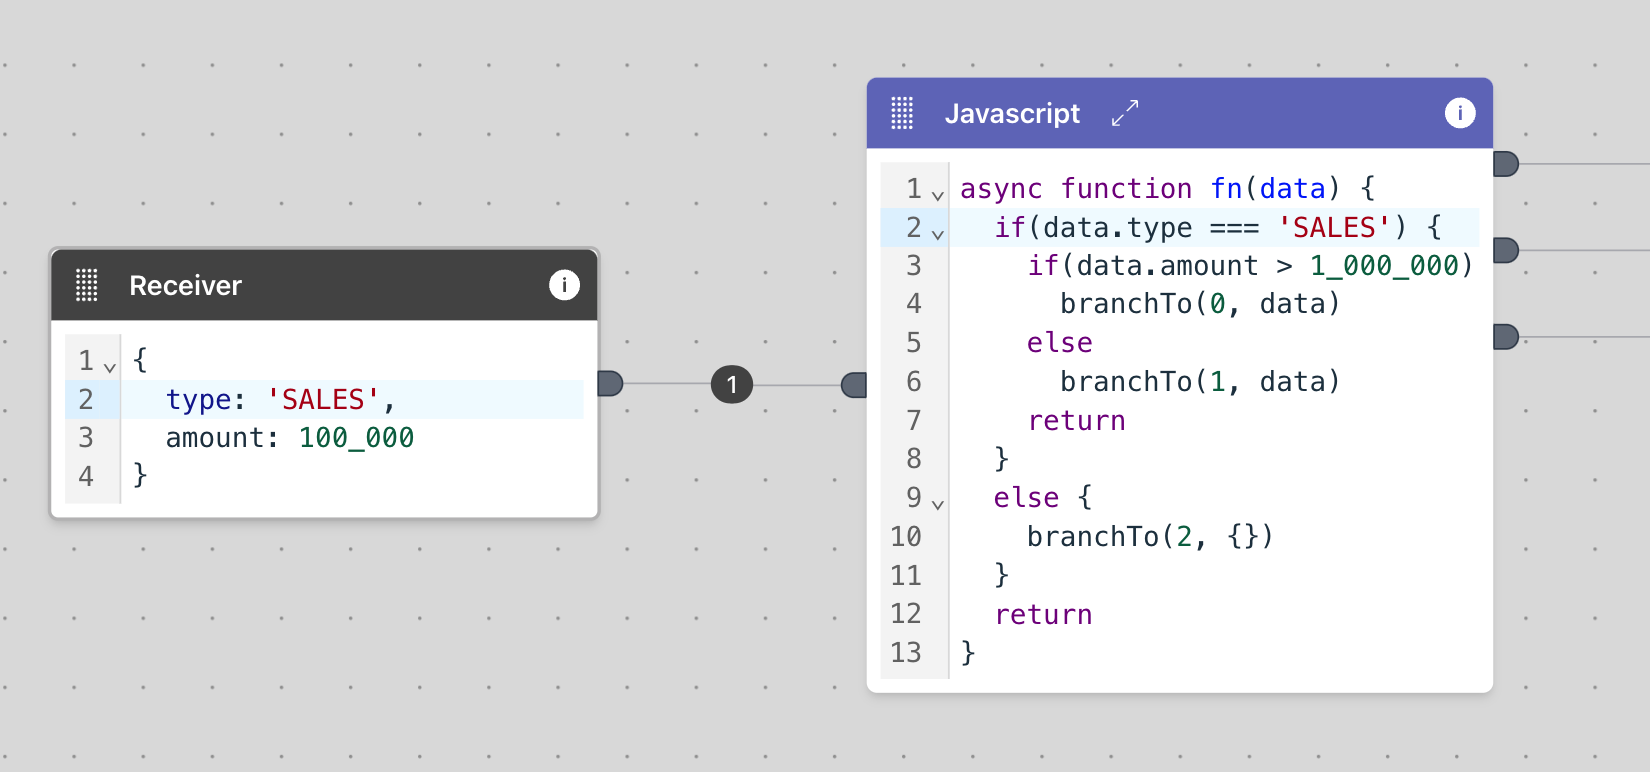
The output connectors will automatically be validated and created as you enter the branchTo() commands.
You should not return any data using return {edge1: someObj} with branchTo().
Accessing Ziggy objects, values and methods
You can access various objects and values from the code editor. Basic auto-completion will help you find the object or value as well as available options for each one.
Console output
You can output information to the editor's console pane (bottom left).
console.log('Hello', value1, value2, ...)
Axios
The axios object is exposed, allowing you to make REST calls.
You will often want to use this in combination with Batching.
Writing to system logs
You can also write to the Ziggy system logs. These are hourly rotated and are located in the /logs folder.
Errors are logged as follows
sysLog.error(msg: string, traceInfo: string, extraData?: any)
All other log level calls .log(), .warn(), .debug(), .verbose() are as follows.
sysLog.log(msg: string, extraData?: any)
Connections
const connection = connections.myConnectionName
This will automatically select the development/production secret as determined by the prod/dev mode.
Secrets
Secrets can be accessed as follows.
const pw = secrets.NORTHWIND_DB_PASSWORD
This will automatically select the development/production secret as determined by the prod/dev mode.
Data Store
Refer to Data Store methods for available methods.
const customer = await dataStore.get(myEntity, myKey)
Memory Store
Refer to Memory Store methods for available methods.
const customer = await memStore.get(myKey)
Execution IDs
You can access the following execution IDs.
const ctr = executionCounter
const id = executionId
const externalId = externalExecutionId
externalExecutionIdis an optional value that can be passed into the Flow when launched externally. This allows the calling system to provide a value associated with the execution for you to work with.executionCounteris a simple sequential counter that resets to 0 when the Ziggy server restarts. It's main purpose is debugging and is not broadly useful.executionIdis a GUID for the individual execution. Again, the primary purpose is debugging.
Snooze
You can use the snooze() method to pause execution for a specified number of milliseconds.
await snooze(1000)
Batching
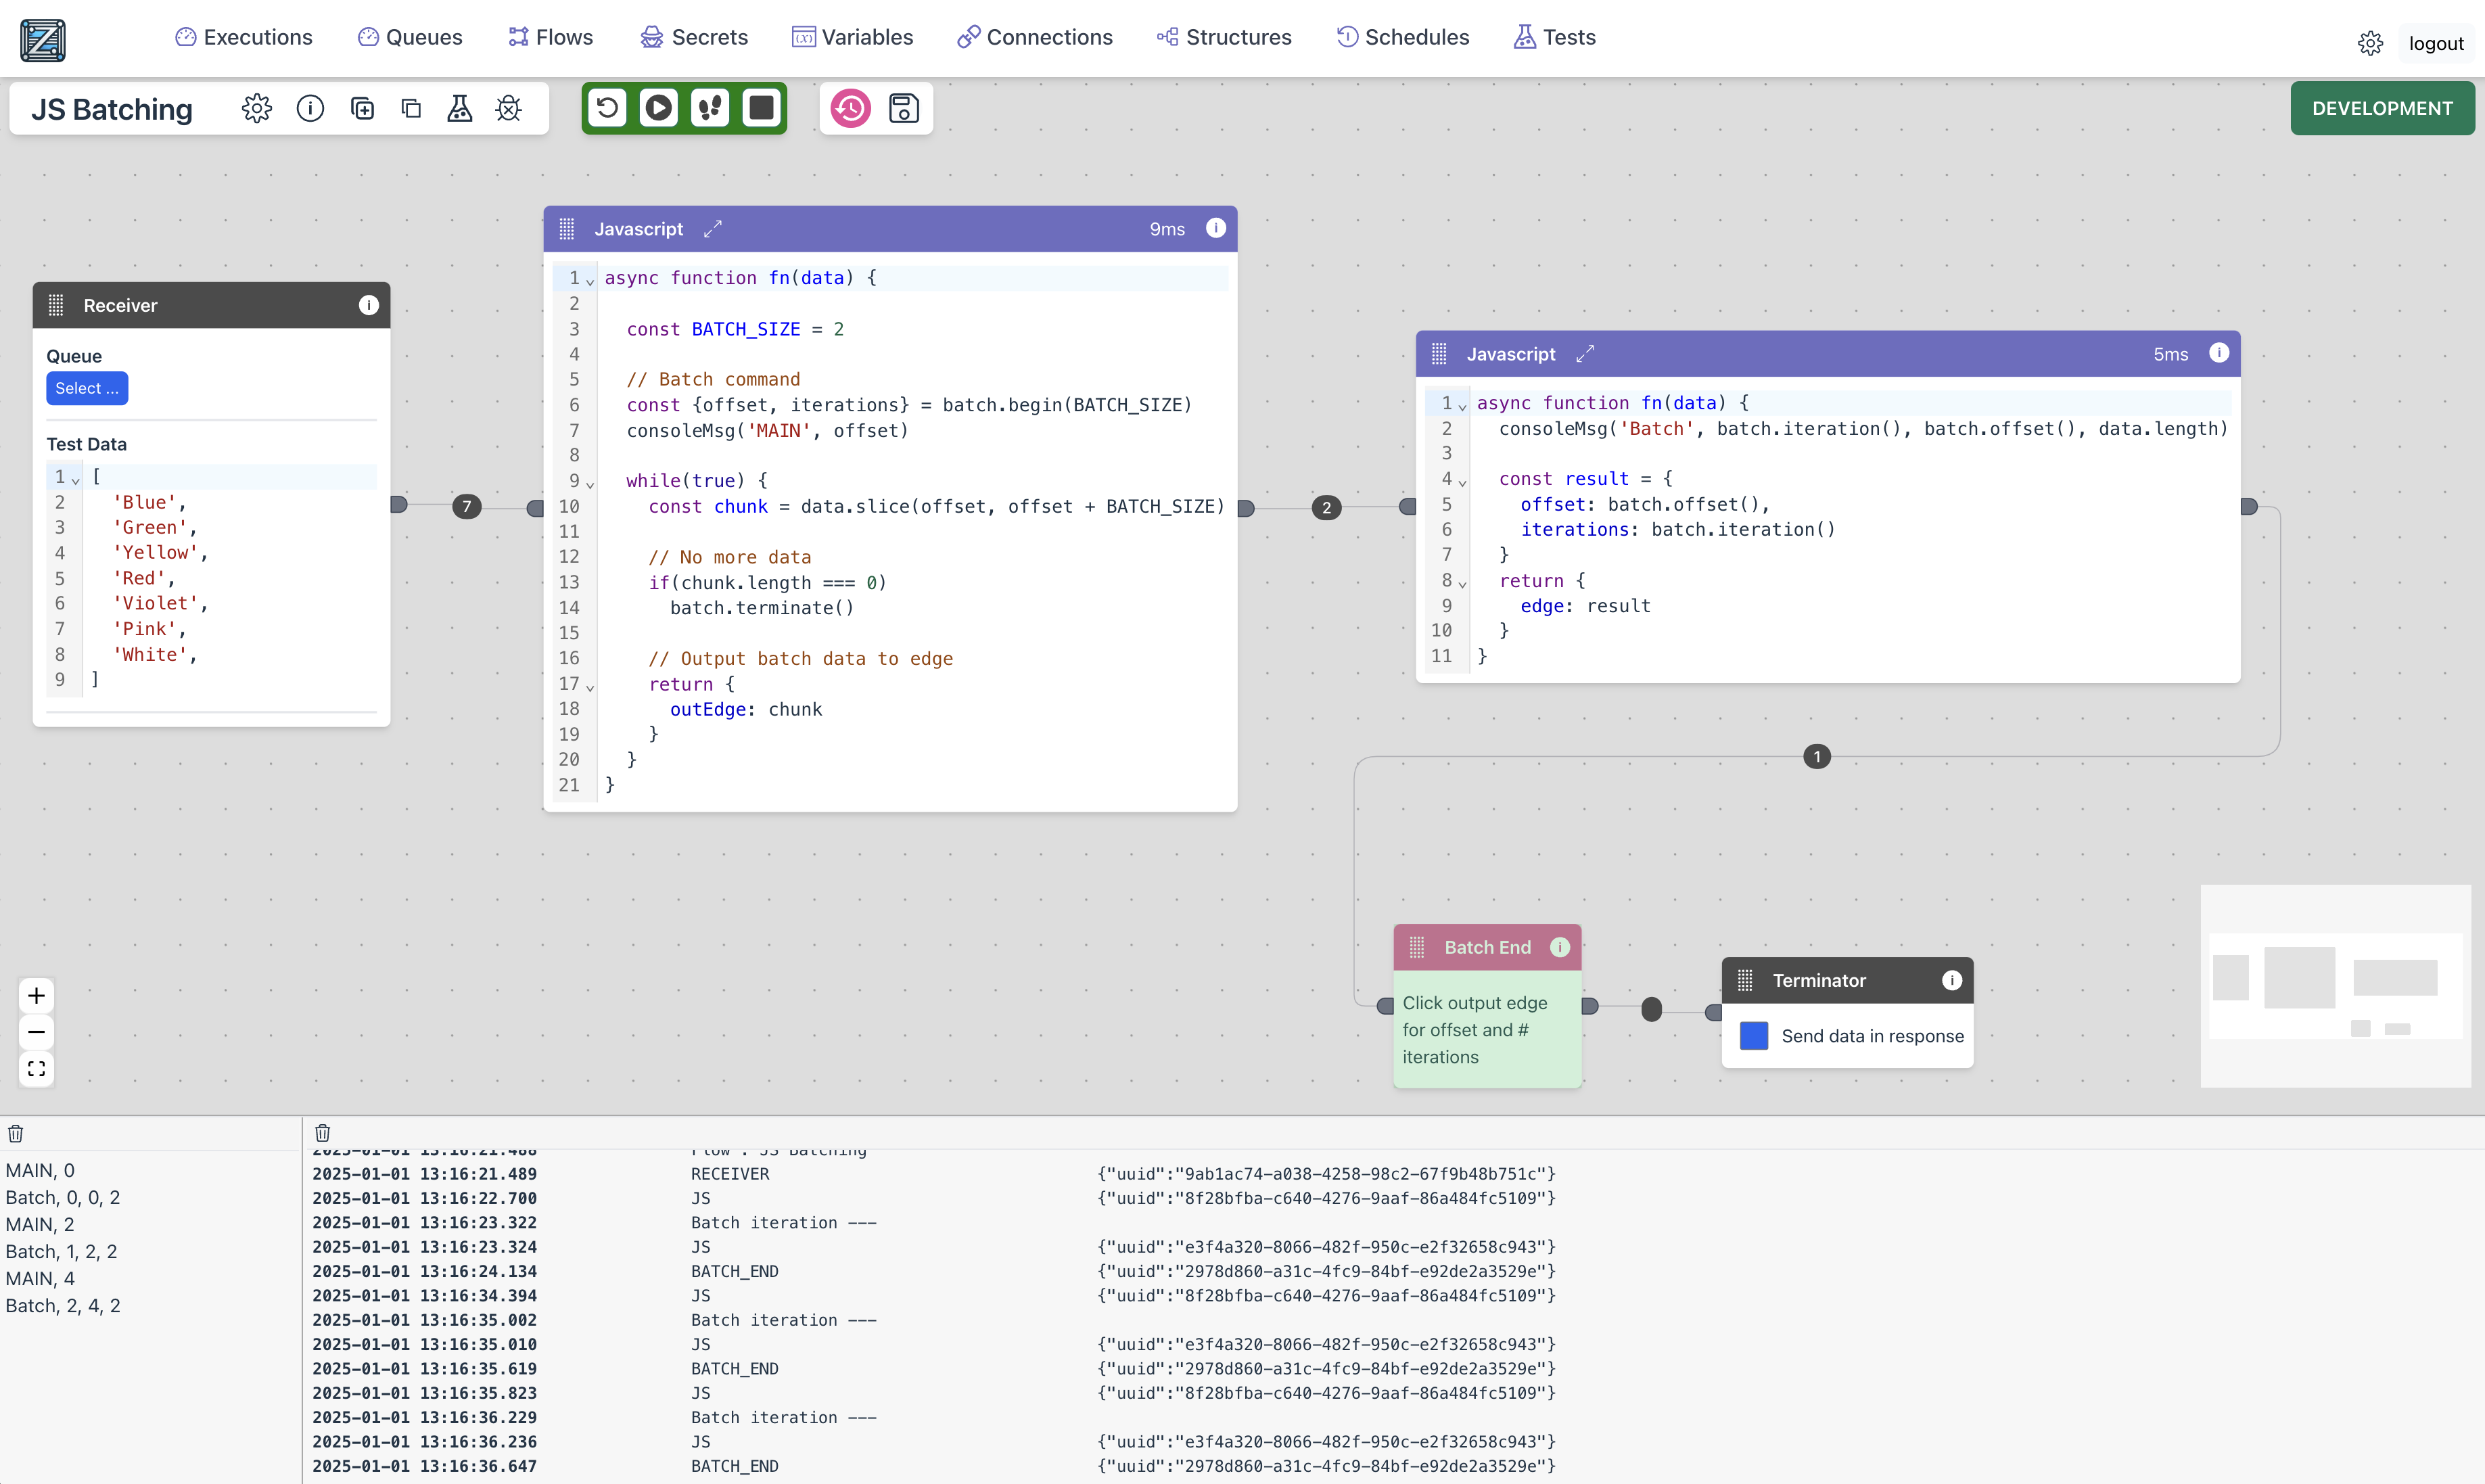
You can perform batching operations with the Javascript Block. Please refer to Batching for general information on Batching.
Available methods
You should use the batch object, which has the the following methods.
batch.isBatch - tests whether the Flow is in a batch at the point the Javascript block executes.
batch.begin(batchSize)- informs Ziggy that this is the starting point for batch operations and the size of each batch. This returns{offset: x, iteration: y}wherexis the number of records processed by the batch loops so far andyis the batch iteration.batch.terminate()- once there is no data left to process, call this to continue execution after the Batch End Block (or Terminator if there is no Batch End Block.)batch.iteration- returns the batch iteration counter.batch.offset- returns the current record # offset from the first batch, in other wordsbatchSize * batchIterations. The value shown is the offset for the start of the next loop.batch.batchSize- returns the number of records per iteration of the batch.
Alerts
You can generate a custom alert. This adds an item to the Log and will also send an email alert.
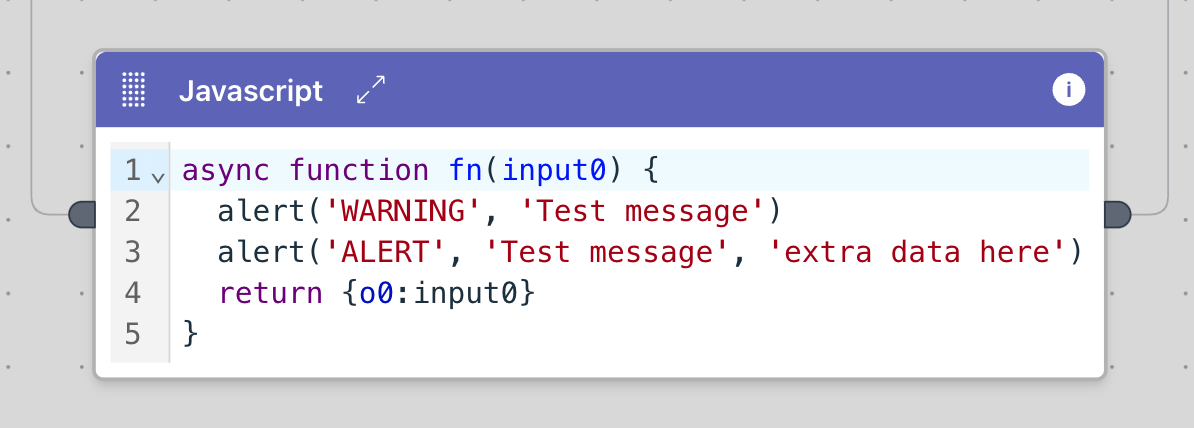
alert(alertLevel: string, message: stringe, extraData?: string)
The first parameter (required) should be one of the following.
- WARNING - this will not create an alert notification but it will show up in the Log.
- ALERT - generates a log entry and sends an alert notification.
- IMMEDIATE - sends an alert notifcation immediately rather than waiting for the digest notification to be sent.
The second parameter (required) is notification message.
The third, optional, parameter is any additional data you may want to add to the log. It will not appear in the notification.
Worker Pool - performance tuning
Ziggy provides a worker pool in which all Javascript Block code runs. The default pool size is 5. This is usually enough for most applications. However, if you have many simultaneously executing Flows and where the code is long-running (which should be avoided), then you can increase this in one of two ways.
A temporary increase (until the server restarts) is made from Global Settings.
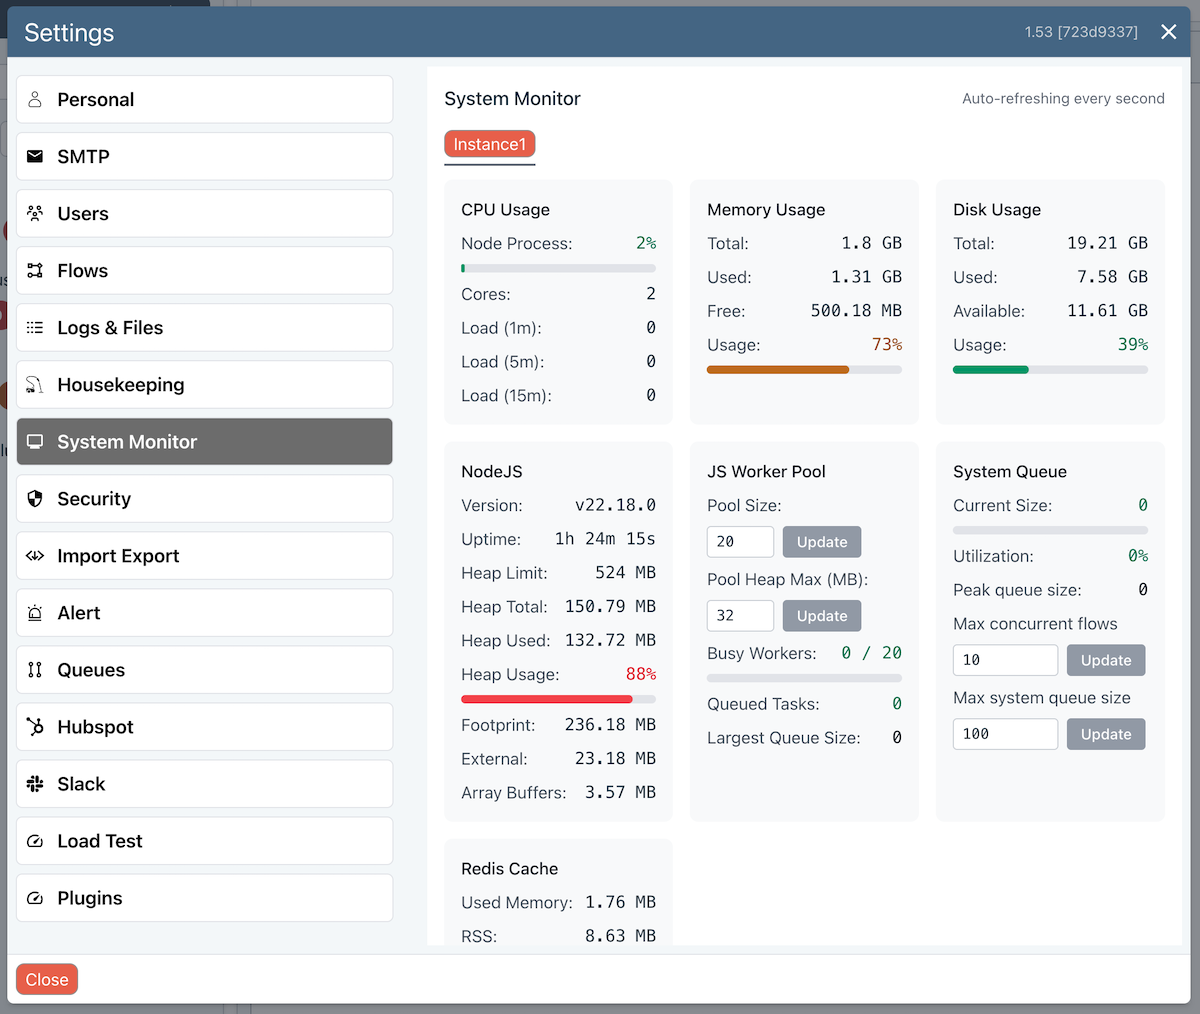
If Largest Queued Size is 0, then you have not exceeded the queue size since the server restarted.
You can permanently increase the pool size by changing JS_WORKER_POOL_SIZE=5 in the .env file.
Formatting
You can use prettier type code formatting by using the following keyboard shortcuts.
- Mac : Shift + Cmd + P
- Other : Shift + Alt + F
Debugger
The Javascript Block has debugging support. This is still in beta, so please be aware that there could be some issues.
To enable debugging, check the Debug box. The debug icons will then appear.
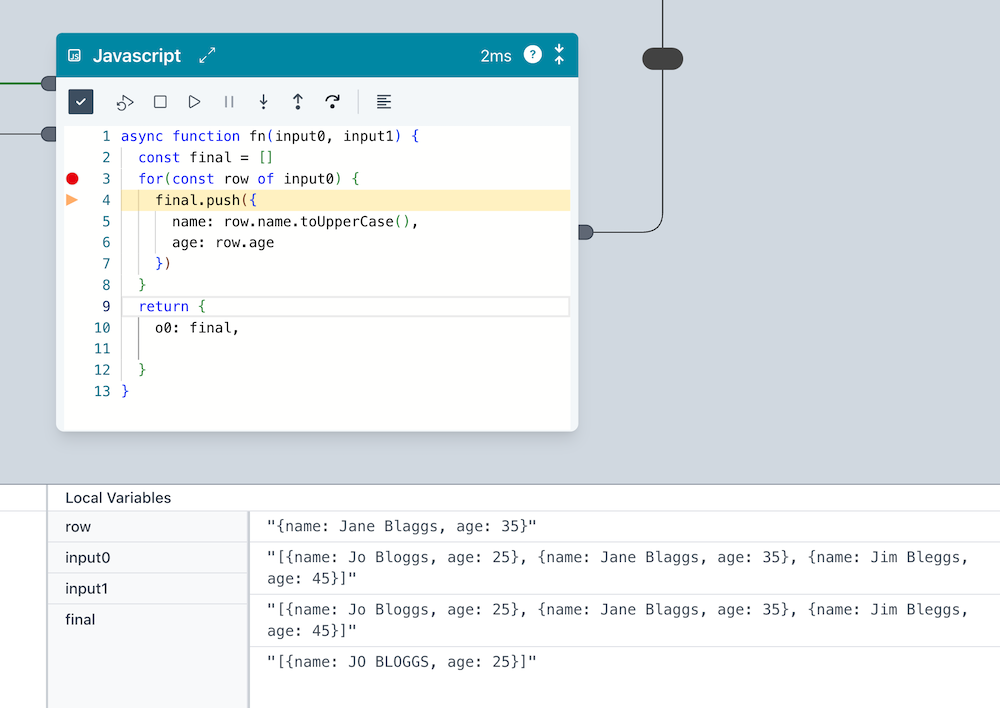
- You can see the breakpoint set in the gutter.
- The line where code execution is paused.
- In the bottom pane, you can see the local variables.
Use the debug icons to step over code etc.
AI Assistant
Press the lightning icon at the top of the block to reveal the assistant (see screenshot below). Due to space constraints, you may want to change to the full screen mode.
Important : the assistant will usually do a better job if the Flow has been run up to the Javascript Block so the input edge(s) are populated with data.
Basic Block
Here's a basic block with nothing added to it.
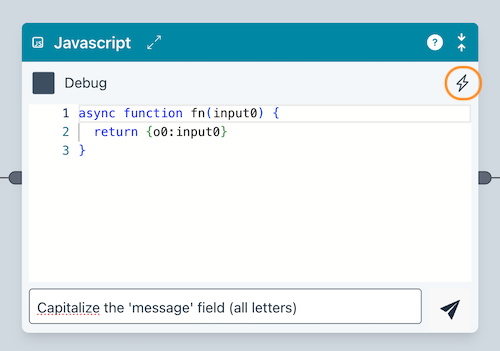
Coding instruction
You can see how we have asked it to capitalize the message field (see the input field at the bottom of the code in the above screenshot). This uses the edge input data for extra context, which is why it's important to run the Flow first so the input edge has data.
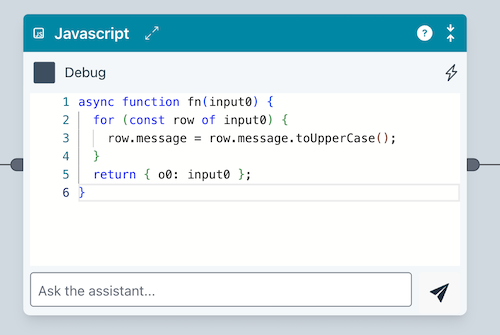
You can continue to issue instructions to modify the code. It will always use the current code as context.
Explain
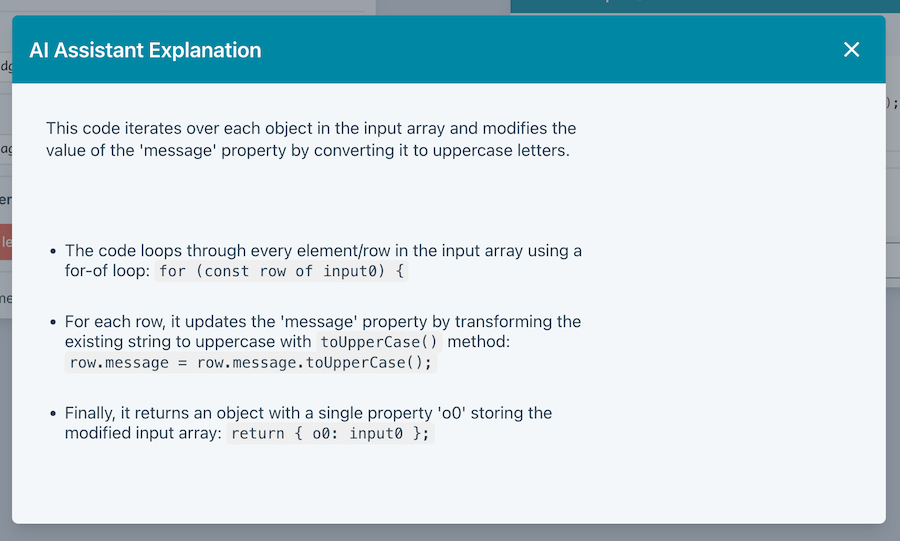
You can also ask specific or general questions like "What does this code do?" or simply "explain".
Reverting
If the AI Assistant messes up your code, just use Undo.