Performance Tuning & Monitoring
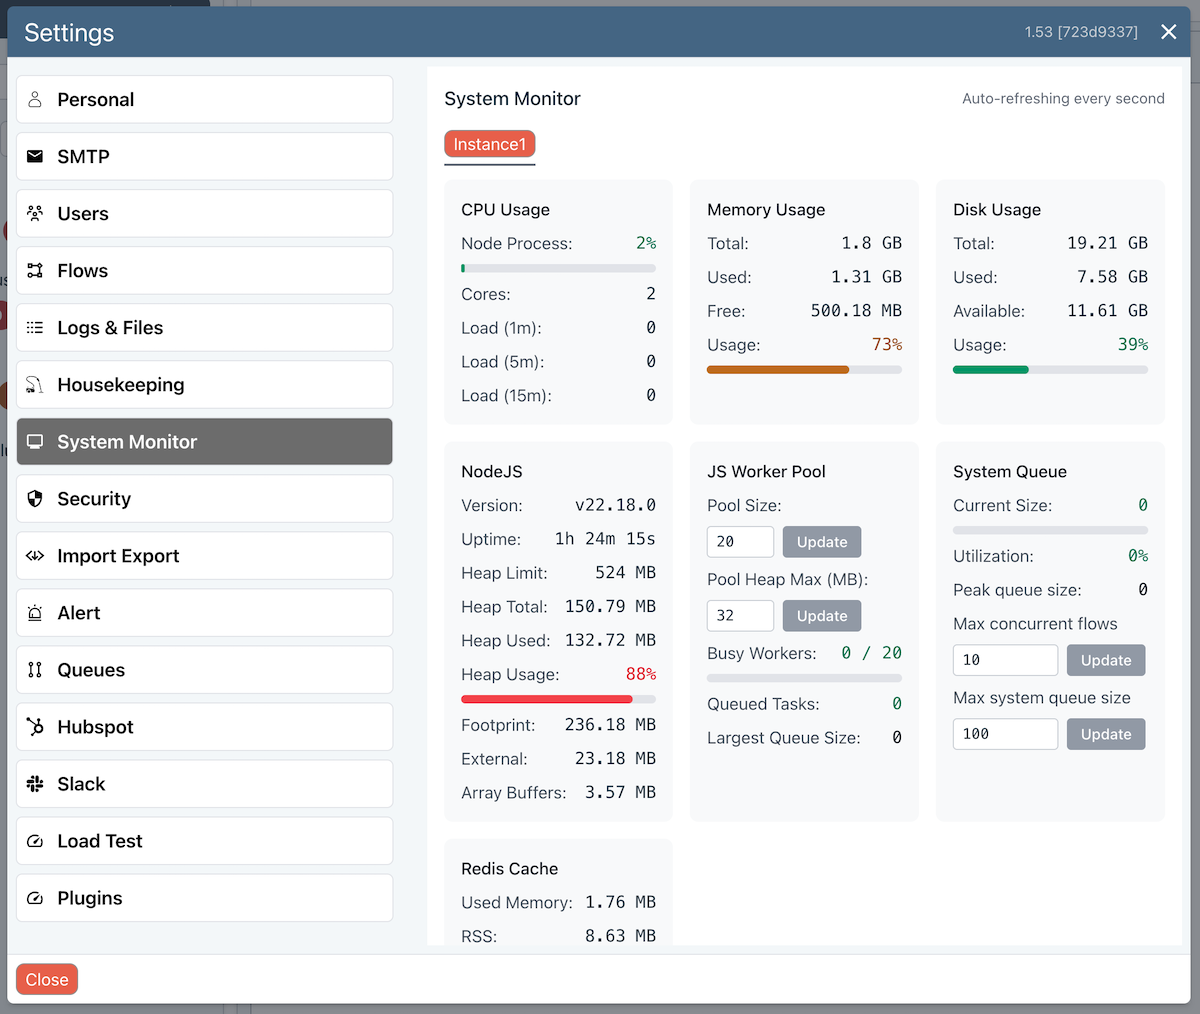
You can adjust the system performance by adjusting the following values in the System Monitor section of Global Settings.
- Maximum concurrent flows
- Maximum system queue size
- Javascript Worker Pool size
- Javascript maximum heap size
There are limits to how much performance you can squeeze out of a single server, at which point you should consider a multi-server configuration.

Tuning strategy
The main consideration when tuning is the available memory. It is worth considering the following when adjusting key values.
- Performance depends on the nature of your flows and available memory. You switch to a Cluster when you need more performance and high availability.
- The Load Tester (or running your own external load testing) is a useful way of getting a handle on performance.
- You should be aware of the Queues screen and the Flow Execution Monitor, both of which give you useful insights into current flow load and peaks.
- The NodeJS process is where the core of the application runs. It does not need lots of memory but it should not be getting close to the Heap Limit (which can be adjusted in your
.envordocker-compose.yamlfiles). - Max concurrent flows will impact the NodeJS heap size but the actual amount depends very much on the nature of your flows.
- The Javascript Worker Pool settings have an immediate impact on memory. If you make only occasional use of the Javascript block or they are very short running, you can afford to have a lower value. You can inspect the Queued Tasks and Largest Queue Size values to see whether you are exceeding the pool size.
- When flows are queued (System Queue) then performance will degrade somewhat. If they overflow (Queues screen or Load Tester) then performance will slow further as they persist to the database to avoid memory overload.
Maximum concurrent flows
The nuber of flows that can execute simultaneously on the server. The default is 10, but you can increase this significantly higher if required.
The impact on system resources will depend on what your flows do and how resource intensive they are. Generally speaking, memory is not heavily impacted unless your flow makes heavy use of the Memory Store block.
Maximum system queue size
To protect against system overload, Ziggy uses a System Queue for all Flows Executions. The only exception to this is an externally launched Flow where the doNotQueue query parameter is set.
If a flow is invoked and the number of currently active flows exceeds Maximum concurrent flows, it will be added to the system queue. This is a memory based queue that store the flow job metadata. If no data is passed into the flow then this will be very small (~1KB).
If you are passing in large payloads, then the impact on memory will be related to the size of this payload and the number of flows that are queued. The default value is 100, but you can increase this as you require.
System queue overflow
Once the system queue is full, flows will be persisted to the database. The throughput will drop somewhat once the overflow is being used. If the overflow size gets too large, it is a clear sign that you need to adjust Maximum concurrent flows, Maximum system queue size or add another server to a Ziggy cluster.
Javascript workers
Javascript Block code is executed in isolated worker processes. Ziggy manages a pool of workers, which are pre-allocated and therefore have an immediate impact on total system memory consumption.
The total memory required is Pool Size * Heap Size.
The pool size is 20 by default, but you can increase this in the System Monitor.
When you change either value, the server will make immediate adjustments. If there is not enough memory to accommodate the values then it will allocate as many workers as it can without overloading memory.
Monitoring
There are two ways to monitor the load and the flow throughput.
- In the System Monitor section of Global Settings.
- From the Flow Execution Monitor.
You can also configure Alerts if system resource limits are exceeded.
Load Testing
For many customers and use-cases, load will not be a problem. However, for higher workloads, Ziggy's integrated Load Testing utility lets you test performance under varying levels of load.
Adjusting the above settings in combination will help you find the best settings for your flows.