Flow Execution Monitor
Open the Flow Execution Monitor by pressing the orange icon in the left of the nav bar.
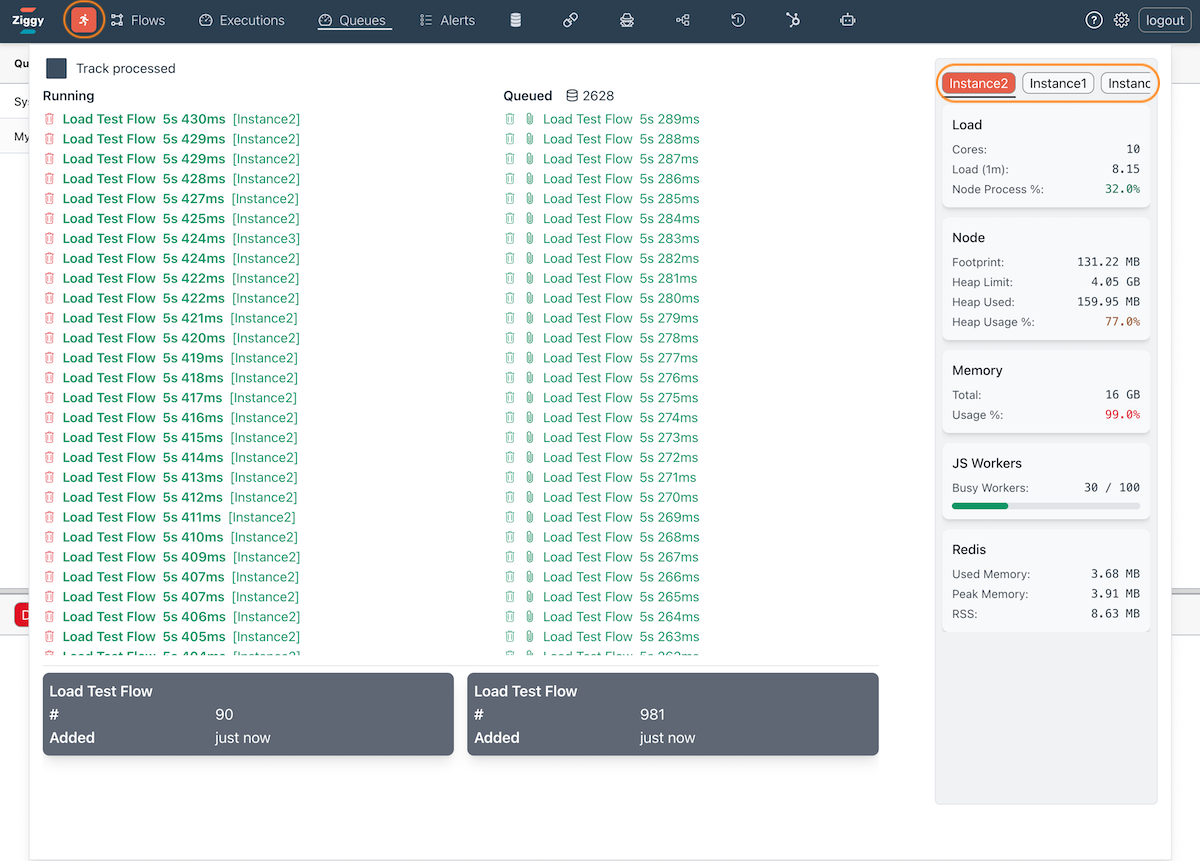
This dashboard shows the following information that is refreshed every second.
- Running - the currently executing flows.
- Queued - the currently queued flows. The database icon shows the current size of the overflow table. Non-zero values are an indicator that performance tuning may be required or another server should be added to the cluster.
- Aggregated - the two gray boxes at the bottom show, for each flow, the total nuber of running and queued flows and when the oldest flow was created.
- Server Performance - in the right column are all important server performance indicators. If you are running a cluster, you can switch between servers.